



Photo by Josh Rakower on Unsplash
Read this article on our new ADMIN website
https://www.admin-it.io/centralized-logging-with-loki-seaweedfs-and-grafana/
Centralized Logging with Loki, SeaweedFS, and Grafana
Cool and Collected
If you have to manage hundreds of instances or devices at the same time, you cannot simply use SSH to connect to each separately and examine specific log messages. Classic solutions to this problem from software vendors include the Elasticsearch, Logstash, and Kibana (ELK) stack (Figure 1) or Splunk.
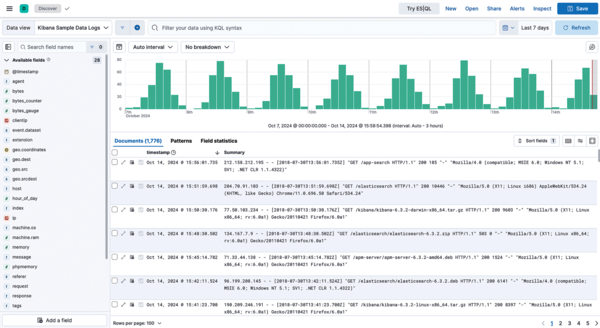 Figure 1: Kibana is the ELK stack's standard tool for sifting through log messages. ELK itself, though, is a complicated beast with tough hardware requirements. © Kibana
However, if you have ever attempted to set up a DIY ELK stack on a six-core server, you will be all too aware of the issues. At first, everything looks fine, then Elasticsearch happily dumps entries onto the disk, RAM utilization escalates into the double-figure gigabyte range, and by the end of the week, you have a server that is almost exclusively occupied with managing itself. If you can afford to do so, you might then turn to Splunk; just make sure you are sitting down when you see your first license bill. For decades, logging in the Linux world has suffered from being either too bloated, too expensive, or both.
Starting in 2018, Grafana Labs has filled this gap with Loki
...

Read this article on our new ADMIN website
https://www.admin-it.io/centralized-logging-with-loki-seaweedfs-and-grafana/
Buy this article as PDF
(incl. VAT)
Buy ADMIN Magazine
Related content
-
Central logging for Kubernetes users
 Grafana's Loki is a good replacement candidate for the Elasticsearch, Logstash, and Kibana combination in Kubernetes environments.
 -
Getting started with Prometheus
 Prometheus is a centralized time series database with metrics, scraping, and alerting logic built in. We help you get started monitoring with Prometheus.
 -
Ubuntu Server 22.04 LTS (Install)
 The Ubuntu Server 22.04 (Jammy Jellyfish) long-term support (LTS) release is suitable for enterprise-class deployments "from the data center to the edge" and will be supported until 2032.
Subscribe to our ADMIN Newsletters
Subscribe to our Linux Newsletters
Find Linux and Open Source Jobs
Most Popular
Focus On Self-Hosting
• Reliable Network Storage with TrueNAS Community Edition
• Self-Hosted File Syncing with Seafile
• Wiring the Modern Stack with Node-RED
• Self-Hosted Collaboration with Forgejo
• Self-Hosted PaaS with Coolify
• Build and Host Docker Images
• Self-Hosted Pritunl VPN Server with MFA
Support Our Work
ADMIN content is made possible with support from readers like you. Please consider contributing when you've found an article to be beneficial.