« Previous 1 2 3 Next »
Intelligent observability with AI and Coroot
Silent Observer
The World of eBPF
Coroot also can read metrics data, logs, traces, and existing monitoring profiles from Kubernetes clusters through their APIs. The Coroot cluster agent takes care of this process, but the unique selling point in terms of tapping data is the Coroot node agent, which relies on the extended Berkeley Packet Filter (eBPF) technology [9]. This technology has already been the subject of several articles [10]. Considering its power, it is surprising that eBPF is not more popular or at least more widely known.
eBPF is a component of the Linux kernel and enables certain programs to run in a type of virtual machine (VM) inside the kernel with full access to the network stack. Just as all packets of a system pass through Netfilter and can be manipulated with the help of nftables, they also flow through the in-kernel VMs that you configure with the aid of eBPF. All traffic flowing through can be analyzed at will and manipulated if needed.
As a comparatively modern technology, eBPF does not have any legacy ballast, which makes it as fast as lightning. Proof-of-concept projects are already on the market to implement a complete packet filter in eBPF. This setup is far faster than the traditional Netfilter, so it stands to reason that eBPF would attract the attention of a solution such as Coroot.
If Coroot is viewed as a monitoring tool in the broader sense, it faces practically the same challenges as any other such system. For something to be monitored, runtime data from a tool or application somehow needs to find its way to the monitoring tool. In techspeak, this is referred to as instrumentation (Figure 1).
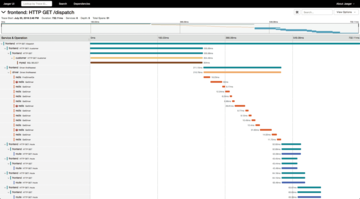
 Figure 1: Administrators of distributed applications often use Jaeger to implement observability, so the application must actively output data to the observability tool because tracing would be impossible otherwise. © Jaeger
If you look at legacy monitoring tools, the checks that admins store for certain services on individual systems do exactly this: They collect data as the object of monitoring. The problem in distributed environments, which automatically also means container environments, is their very dynamic nature, and legacy monitoring tools find it difficult to cope with this complexity. Moreover, metrics data is generated in so many different places that it would be a painstaking process to roll out a data collector for each and then integrate the data into the monitoring setup.
Today's microcomponent-based applications, in particular, add a whole new level of complexity. Besides monitoring the applications themselves, the individual pieces of information change in many ways on their way through the components of such a construct. Documenting these changes for monitoring purposes is often very useful or even essential.
In practice, the entire OpenTelemetry project spends most of its time creating interfaces to which external tools can dock and that support an exchange of metrics data and tracing. I've already looked at Jaeger [11] in detail in this context; the tool evaluates OpenTelemetry-compatible traces, making it possible to track how data changes en route through a microcomponent application.
For this principle to work, either the application must be integrated with the OpenTelemetry SDK or the OpenTelemetry Collector must be able to access the data from outside to the greatest extent possible. In both cases, you need to add specific support for the required monitoring system to the app.
If you transfer the principle to a solution like Coroot, every application on any Kubernetes cluster anywhere in the world would then have to know about the existence of Coroot and actively feed it metrics, logs, and traces, which is not convenient or trivial.
Therefore, the Coroot developers took a different approach with eBPF to extract and process a large part of the data required for analysis directly from an application's network traffic. This zero-instrumentation approach is attractive from an admin perspective. Once Coroot integration has been rolled out for a cluster, the data for monitoring automatically migrates from there to Coroot for analysis. Unlike other scenarios, you no longer need to connect each individual app, which is true – another important point – irrespective of how the application changes during its runtime.
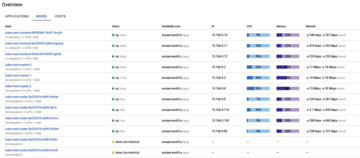
For example, if Kubernetes starts more instances of the same service with a scale set to balance higher loads, the use of coroot-node-agent automatically takes it into account. The component hooks into eBPF on each system belonging to the cluster to intercept the relevant data. This arrangement sounds good in theory, and it works extremely well in practice: Coroot starts fielding comprehensive metrics, logs, and traces shortly after commissioning in a cluster, which means it can start analyzing the data straightaway (Figure 2).
 Figure 2: The Coroot user interface provides initial insights shortly after the solution goes live. It automatically recognizes a large proportion of the rolled-out resources thanks to its zero-instrumentation approach. © Coroot
Opportunities
The Coroot developers have greatly expanded the scope of their solution in recent years. Whereas the main selling point was initially that of detecting threat scenarios with AI and writing comprehensive, automated root cause analyses (RCAs), the focus is now more broadly the entire topic of observability. Although AI-supported attack detection still plays a major role, Coroot is now capable of doing significantly more. A few examples quickly illustrate this facility.
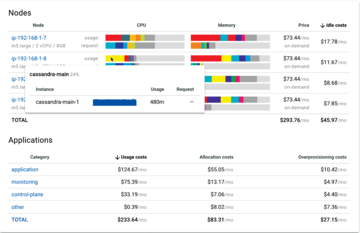
The Coroot developers have expanded their product to include the option of evaluating accounts with hyperscalers in terms of cost and efficiency. This challenge is familiar: Amazon AWS, Microsoft Azure, and Google Cloud Platform (GCP) make it child's play to provision and use virtual infrastructure, but none of the three providers view themselves as IT charities. If you don't pay close attention to the costs per hour during deployment, you could be in for a nasty surprise at the end of the month. If you supply the login credentials for a cloud account, Coroot will automatically connect to the API, read out the applicable prices, and generate an overview of the costs incurred.
Once again, Coroot uses AI to create a kind of dynamic analysis of the rolled-out setup and makes suggestions with a view to potential optimization. The mantra of the Coroot developers is clear: You need a comprehensive treasure trove of data at your disposal to be able to carry out comprehensive analyses, which is precisely where Coroot can help you. That said, Coroot's cost-tracking functions primarily focus on the hyperscalers' managed Kubernetes offerings. If you use Amazon Elastic (EKS), Microsoft Azure Kubernetes Service (AKS), or Google Kubernetes Engine (GKE), you can use Coroot to export and analyze metrics data automatically from rolled-out clusters (Figure 3).
 Figure 3: In Kubernetes setups for hyperscalers, Coroot automatically correlates resource usage and computes the incurred charges. It also points out ways of optimizing the setup to help you save money. © Coroot
If you automatically collect a wide range of data in your setup in the scope of threat detection, you can also use the data for other purposes. For example, the Coroot developers point out that the data pool is ideal for monitoring service level targets right down to individual instances of a single service whose availability can be permanently tracked by Coroot. The Coroot graphical user interface, which can draw comprehensible graphics from the available data, is a massive help in this scenario.
If you really want to, you can even use Coroot to record and plot individual outliers (e.g., in the response time of a service). Helpfully, Coroot can create a complete performance profile for practically any application in a cluster through just a few mouse clicks. The results show which individual functions were called and detail their processing times.
Observability is not something you implement just for fun; however, Coroot makes many things easy. Where you previously had to spend hours rolling out companion services and entire observability platforms, Coroot is almost fun. A number of correlations that were previously completely hidden from your eyes can now be displayed thanks to Coroot teamed with eBPF.
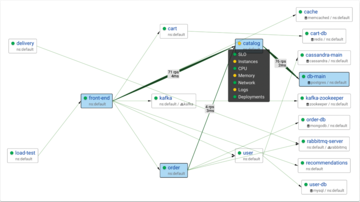
If you want to trace the communication paths of the applications in a virtual Kubernetes setup comprising several containers, for example, you often used to have to sit down for hours with a pen and paper. Thanks to Coroot, a map displaying all the communication flows in a setup is virtually a side product of the monitoring that takes place anyway (Figure 4).
 Figure 4: Coroot generates a complete matrix of communication solely from recorded data that would otherwise involve a huge amount of manual work. © Coroot
Comprehensive Alerting
The practical use of an observability solution would be severely impaired if it could not inform anyone about impending trouble or about its findings in general. The Coroot developers offer a comprehensive solution by seamlessly connecting to various pager and operations services out of the box, including PagerDuty [12] and Opsgenie [13]. Alerting can also be set up in this way.
If you prefer a more down-to-earth approach, you can connect Coroot directly to Slack or Microsoft Teams and receive messages by instant messenger in the traditional way. A webhook option is also available that involves Coroot simply calling up a URL when a defined event occurs; the URL can trigger practically any action, including sending email or text messages.
All the functions described so far can be linked to alerting. If Coroot is used to monitor service level objectives (SLOs), it can immediately alert you if certain threshold values are exceeded, and you can then take a look at the situation.
« Previous 1 2 3 Next »
Buy this article as PDF
(incl. VAT)
Buy ADMIN Magazine
Subscribe to our ADMIN Newsletters
Subscribe to our Linux Newsletters
Find Linux and Open Source Jobs
Most Popular
Support Our Work
ADMIN content is made possible with support from readers like you. Please consider contributing when you've found an article to be beneficial.


