Mobile PC Monitor: A Sys Admin’s Best Friend
Monitoring your servers requires vigilance and a lot of time. You have to check dashboards, read reports, and drill down to see what’s wrong with a system. These delays can mean the difference between meeting or missing a Service Level Agreement (SLA) between you and your client. And, there’s nothing more embarrassing than confessing to a client that you didn’t know their service went down. You don’t want the client to be the monitoring application that you should have in place. Take an active approach to monitoring with MMSOFT Design’s (MMSOFT) Mobile PC Monitor.
The MMSOFT solution consists of an agent, a client, and a dashboard. It sounds like a standard monitoring delivery scenario, and it is, but with one catch: It’s mobile. Mobile means you’re able to monitor your systems from a phone, a tablet computer, a laptop (notebook, ultrabook, netbook), the PC Monitor application, or a web page.
As long as you have access to any type of computer or smart phone, you can stay in touch with what’s happening with your Windows and Linux systems as it happens.
Mobile PC Monitor is a real-time monitoring solution for 32- and 64-bit Windows operating systems and Linux systems. Most of the functions work on both Windows and Linux systems.
The following is a subset of the events that you can monitor on your systems and receive related status notifications:
- Log on/log off
- System start/restart/shutdown/suspended/resumed
- Low battery state
- IP address change
- Application installation/de-installation
- Removable disk inserted/removed
- Critical or important updates available
- Service status
- Memory usage
- CPU usage
- Monitored ports
- Process conditions
- Low disk space
- Event log events
- Hardware conditions
- CPU temperature
- Custom performance conditions
- IIS site and application pool events
However, monitoring is not the only facet of the Mobile PC Monitor tool. If monitoring were its only function, then it would be a formidable piece of software for that single purpose, but the developers at MMSOFT have empowered you to do much more than simple monitoring.
The PC Monitor agent also allows you to perform the following non-monitor functions on your systems:
- Log off/restart/shut down/power off/suspend/hibernate/wake up
- Place systems into maintenance mode
- Manage/install Windows updates
- Manage IIS
- Manage Active Directory
- Monitor and manage Exchange servers
- Monitor and manage Hyper-V
- Monitor and manage VMware
- View OS version information
- View filesystems and files
- List installed applications
- View event logs
- View all running processes
- Manage printers and print jobs
- View logged in users
- Send remote commands via a terminal
- View performance data
- View hardware details
You have several service options with PC Monitor from a free, three-system installation up to an unlimited enterprise-level implementation. You can also choose to set up a dedicated server for its use or to deploy and work from the online service. MMSOFT offers a variety of deployment scenarios that attempt to serve networks of any size.
Installation and Setup
On Windows systems, you’ll need to install the .NET 4.x framework before you install the agent. If your system doesn’t have .NET 4.x, the installer detects that dependency and directs you to the .NET download package. Installation of the .NET 4.x framework doesn’t require a reboot, so you can install one after the other with no delays.
If you’re deploying PC Monitor to several systems, download the agents and save to a commonly accessible location on your network. Download and save the .NET framework installer to the same location.
Before installing your first agent, connect to the MMSOFT website and set up your free account. Each agent installation requires you to enter the username and password from this registration.
The agent installer steps you through a short wizard and then launches the monitoring and management customization application on both Windows and Linux. You can customize your Linux installation without using the graphical application. The PC Monitor graphical interface looks exactly the same on Windows and Linux because it is a cross-platform Java application. In Figure 1, I show a screenshot of PC Monitor on Windows.
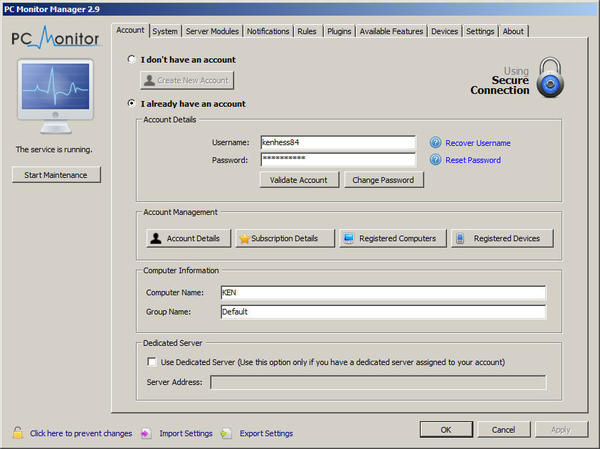 Figure 1: The main PC Monitor configuration window.
Figure 2 is the PC Monitor installation launch on Linux. Answer ‘No’ (n ) to the Start the PC Monitor Manager question.
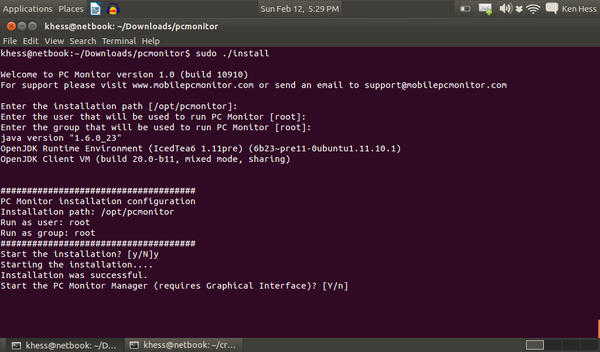 Figure 2: Installing PC Monitor on Linux, phase one.
Figure 3 shows the result of using the command-line installation of PC Monitor on Linux.
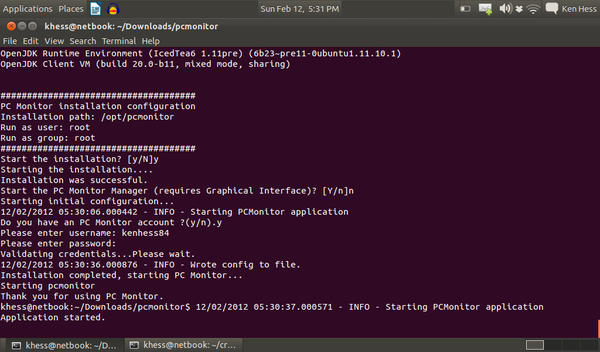 Figure 3: Completing the PC Monitor installation on Linux.
Note that your password appears in plain text on the screen. I removed my password with GIMP to protect my privacy. Use caution when entering your account password at the command line. The graphical application hides your password.
I have tried both the command-line installation and the graphical installation on Linux. If the graphical setup doesn’t work for you, use the command-line method and then open the graphical application (PC Monitor Manager) to customize the installation as described in the next section.
Monitored Services and Notifications
You must perform this portion of the setup on each of your monitored systems. I cover the major service areas in this demonstration, but you should click through each of the tabs in the PC Monitor Manager (PCMM) to customize your monitors and notifications. A default installation only provides minimal online/offline monitoring. You’ll need to navigate through the PCMM in a detailed way to set up your desired alert level for each system event and service. To begin, select the System tab. Figure 4 is a screenshot of the default level of general system monitoring.
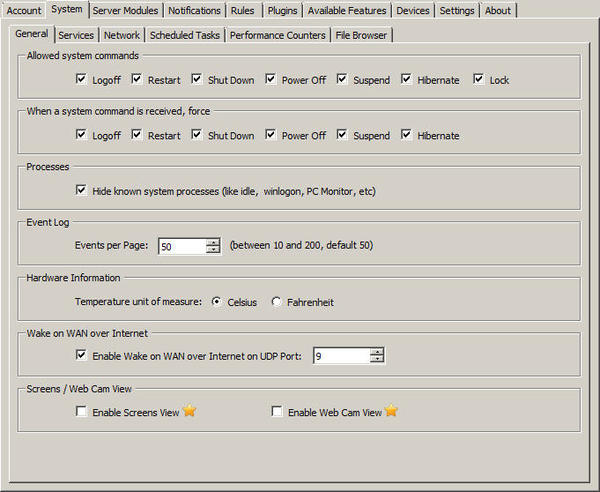 Figure 4: PC Monitor Manager general system availability monitors.
Click the Notifications tab in the primary tab list. Because I want a very detailed look at what’s going on with my critical systems, I select all of the possible notifications on this tab (Figure 5).
 Figure 5: System status notifications.
Select the Performance tab on the secondary tab list. I have accepted the default settings for the notifications that I want for this particular system (Figure 6).
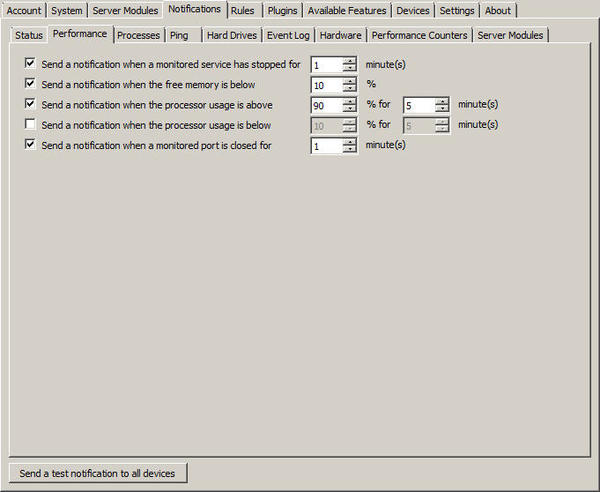 Figure 6: Setting notification preferences for system performance thresholds.
I left the … processor usage is below selection unchecked because I’m not concerned whether this system remains idle for any length of time. You might want to know if a system is generally idle so that you can redeploy, add workload, or decommission the system.
The rest of the Notifications tabs at this level are for custom notifications if certain conditions are met.
Click on the Available Features tab in the primary tab list to select the system parameters you want to see in the system drill-down in the monitor application (I cover the details of the selections you make here in the next section).
Administrators who care about security might want to click on the Devices tab and authorize a short list of devices capable of interacting with their monitored systems. Only devices that have been paired with the agents will appear in the browse list. Click the Authorize New Device button to browse for paired devices. For example, in my browse list in Figure 7, you’ll see my iPad (Ken’s iPad ). I have more on the iPad in the “There’s an App for That” section of this article.
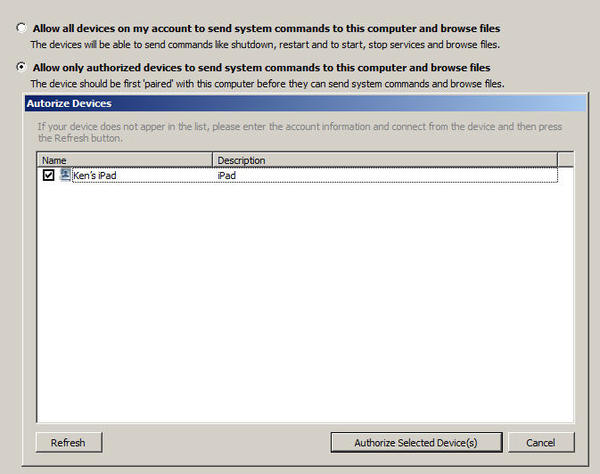 Figure 7: Authorizing a device allowed to manage an agent.
Select any devices in the list and click the Authorize Selected Device(s) button. To remove any authorized devices in the list, select the device and click the Revoke Device Authorization button. That device will no longer have access to your monitored systems.
When you’ve finished making changes to your agent configuration, click the OK button. You can return to the configuration at any time to make changes. Changes to the configuration are applied immediately to the agent.
Advanced Usage and Administration
After installing and setting up the agent software to monitor system events and send event notifications, it’s time to view the event console for your systems. Download and install the PC Dashboard (found on the MMSOFT downloads page) application to your Windows computer. This application is a dedicated event console for all registered systems under your account. Each time you install and validate your login credentials for an agent, your new system appears in your console’s inventory.
The PC Dashboard (Dashboard) is appropriate for technicians who watch event consoles in your organization or for those who want to check in on system health. Beyond watching and clearing events, its abilities are limited. One of the Dashboard’s best features is the scrolling alert crawler (Figure 8).
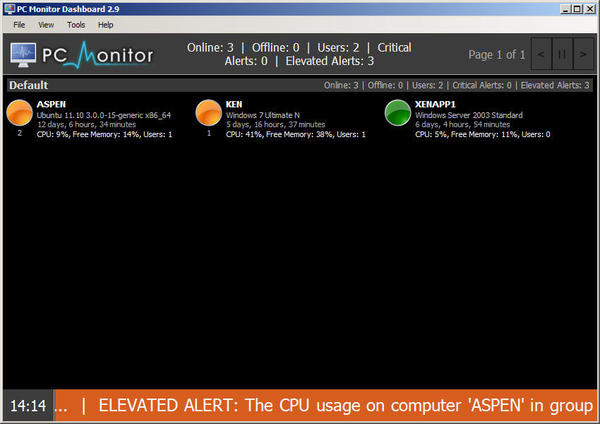 Figure 8: The PC Dashboard application, system inventory, and alert crawler.
Important system events scroll across the bottom of the console screen to ensure that you see them. You can clear events by clicking one of your systems and then clicking Delete All Notifications , as shown in Figure 9.
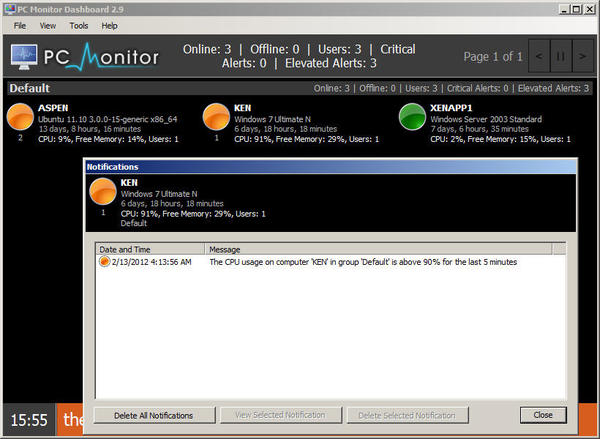 Figure 9: Clearing event notifications from a monitored system.
Confirm deletion to continue. Clearing an event from a monitored computer also removes it from the event crawler. You may selectively delete notifications by clicking the notification you’d like to clear and then click Delete Selected Notification . Note that you do not have to confirm individual alert notifications.
The PC Dashboard is an excellent application for watching your systems on a continuous basis, but if you’re more mobile than a typical console watcher, you require a mobile application. MMSOFT provides an online service at https://my.mobilepcmonitor.com; just log in to check on your inventory. You can access this page from any web browser that supports the Adobe Flash Player (Figure 10).
 Figure 10: PC Monitor inventory web access and system details.
The web application, like the console application, allows for event viewing but is far more powerful in what you can do with it. Warning: Only system administrators should have login access to the web console. The web console allows you to view and confirm events, butyou also have administrative capability. You can run commands on the remote systems, reboot, shutdown, power off, hibernate, kill processes, and much more.
There’s an App for That
As you probably noticed on the downloads page, the iPhone/iPad/iPod, Android, and Windows Phone 7 devices all have apps. I have an iPad, but the apps work the same way on all devices. Warning: Because of the amount of control available to these apps, only administrators should have access to the associated account information.
Download and install the app that’s compatible with your mobile device, log in with your account username and password, and then tap the Validate button, as shown in Figure 11.
 Figure 11: Logging in to the PC Monitor app.
Once you’ve logged in to the app, you’ll see your monitored computer inventory in the Computers list in the left pane. Tap on one of the systems to view its details and overview, as shown in Figure 12.
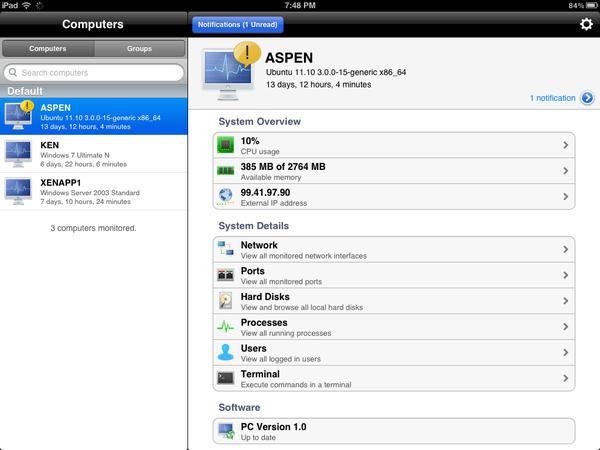 Figure 12: Viewing a Linux system’s details (page 1 of 2).
Figure 13 is a display of the available pre-programmed commands that you can run against a system.
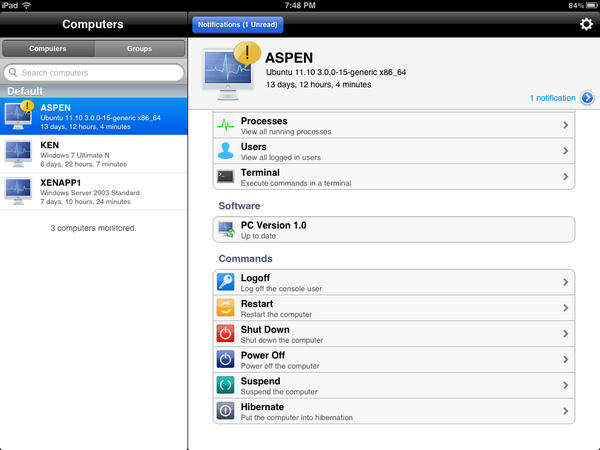 Figure 13: Viewing the list of system commands.
The Terminal window doesn’t work for me on my Ubuntu 11.10 Linux system, and I have reported this as a bug. The terminal window does work on Windows Server 2003, Windows 7, and Windows Server 2008. You can also install available Windows updates within the app, as shown in Figure 14.
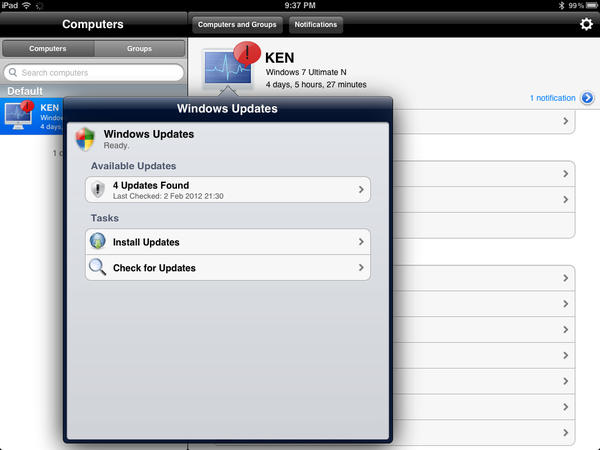 Figure 14: Checking for Windows updates.
The mobile device app and the web interface have equivalent capabilities, so no matter how you can access the environment, you’ll have total visibility and control of your systems.
Summary
As a system administrator, you’ll enjoy the amount of thought that the MMSOFT developers have put into this suite of monitoring and notification tools. Although this isn’t a formal product review, I give their effort a solid nine out of a possible ten.
• Agents are easy to install and easy on system resources.
• The web-based interface is a complete application.
• The PC dashboard is the perfect visual console.
• The mobile apps are fun and powerful applications.
Take the Mobile PC Monitor suite for a spin and see what you think. Personally, I’ve never had so much fun monitoring software, and I’ve seen a lot of it through the years. None of it has ever sparked any excitement for me, until now. System software isn’t the most awe inspiring or thrilling gaggle of bits and bytes you’ll ever interact with, but it’s easy to get excited over finding a new best friend.
Related content
-
Mobile PC Monitor: A sys admin's best friend
 Monitoring your internal server environment just became easier with MMSOFT Design's Mobile PC Monitor software.
 -
Network monitoring with Total Network Monitor
 Even Windows doesn't have to have an expensive network monitoring tool. The free Total Network Monitor helps you keep an eye on your network.
 -
Total Network Monitor
Even Windows doesn’t have to have an expensive network monitoring tool. The free Total Network Monitor helps you keep an eye on your network.
-
Monitoring with System Center 2012 R2 Operations Manager
 Put Operations Manager to work monitoring Active Directory, Exchange, and Hyper-V environments.
 -
Monitoring KVM instances with Opsview
 In emergencies, administrators need to know as quickly as possible whether computers in a private cloud are failing. A simple setup with KVM, Pacemaker, DRBD, and Opsview will help keep watch.
Subscribe to our ADMIN Newsletters
Subscribe to our Linux Newsletters
Find Linux and Open Source Jobs
Most Popular
Focus On Self-Hosting
• Wiring the Modern Stack with Node-RED
• Self-Hosted Collaboration with Forgejo
• Self-Hosted PaaS with Coolify
• Build and Host Docker Images
• Self-Hosted Pritunl VPN Server with MFA
• Self-Hosted Chat Servers
Support Our Work
ADMIN content is made possible with support from readers like you. Please consider contributing when you've found an article to be beneficial.
