« Previous 1 2 3 4 5
Tracking down problems with Jaeger
Hunter
Administrators facing a container-based setup with distributed applications for the first time in their career might hark back to the past and secretly think the old ways were better. From their perspective, at least, you might understand how this misconception comes about. People who used to be responsible for troubleshooting had a few fairly obvious starting points. Large monolithic programs such as MySQL simply output error messages. A look at the logfile was therefore often all it took to get at least a hint of where to look.
If nothing useful could be found in the logfile, you still had the level below it as the starting point. For example, if communication between server and client did not work as described in the documentation, many an admin would turn to tools such as Tcpdump (Figure 1), which lets you read data traffic down to the lowest levels of a network connection for subsequent visualization with Wireshark to check for potential issues. Also, the client could see potential errors and output appropriate messages on the terminal, if need be.
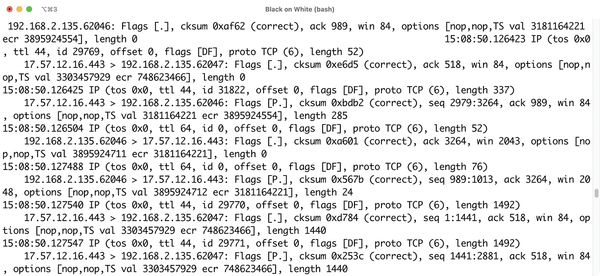 Figure 1: Tools such as Tcpdump used to be all you needed to examine network connections at the application level.
Admins and developers can only dream of such simple debugging mechanisms in more modern applications. If you
...
Buy this article as PDF
(incl. VAT)
Buy ADMIN Magazine
Related content
-
Service mesh for Kubernetes microservices
 Enable free service mesh functionality on your Kubernetes microservice apps with Istio.
 -
Intelligent observability with AI and Coroot
 In the deep waters of scalable environments, observability is more important than ever. Coroot enters the scene with eBPF to intercept traffic and collect data that is of interest for monitoring and attack detection.
 -
Managing network connections in container environments
 Traefik promises not only to manage mesh implementations for container environments reliably, but to do so in a way that makes them enjoyable to administer.
 -
A service mesh for microarchitecture components
 Istio facilitates communication between the many small microcomponents that need to communicate with each other in modern applications.
 -
Grafana and Prometheus customized dashboards
 Grafana analytics and visualization dashboards plus the Prometheus monitoring and alerting tool make possible extensive custom reporting and alerting systems.
Subscribe to our ADMIN Newsletters
Subscribe to our Linux Newsletters
Find Linux and Open Source Jobs
Most Popular
Focus On Self-Hosting
• Self-Hosted PaaS with Coolify
• Build and Host Docker Images
• Self-Hosted Pritunl VPN Server with MFA
• Self-Hosted Chat Servers
• Self-Hosted Remote Support with RustDesk
Support Our Work
ADMIN content is made possible with support from readers like you. Please consider contributing when you've found an article to be beneficial.
