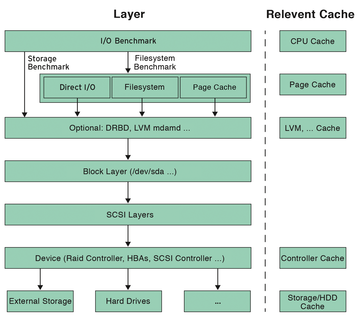
Fundamentals of I/O benchmarking

Measure for Measure

Parallelism

Multiple computers can access enterprise storage, and multiple threads can access an internal hard drive. Not every thread always reads; therefore, you will generally see higher CPU utilization and higher overall throughput initially on increasing the thread count. The more threads you have accessing the storage, the greater the overhead becomes, again reducing the cumulative output.

There is an optimal number of threads, as you can see in Figures 5 and 6. Depending on the application, you will be interested in the single-thread performance or the overall performance of the storage system. This contrast is particularly relevant in enterprise storage, where a storage area network (SAN) is deployed.

Figure 5: I/O operations measured by block size and concurrency on a hard disk using the iops program.
Figure 6: I/O operations measured by block size and concurrency on an SSD using the iops program.

Benchmark tools themselves also have an effect on the measurement results. Unfortunately, different benchmark programs measure different values in identical scenarios. In the present test, the iops tool measured 20 percent more I/O operations per second than Iometer – given the same thread count and with 100 percent random read access in all cases. Additionally, random fluctuations occur in the measurement results, stemming from many influences – such as the status of programs running at the same time – which are not precisely repeatable every time.

The iops Program

The iops [1] program quickly and easily shows how many I/O operations per second a disk can cope with, depending on block size and concurrency. It reads random blocks, bypassing the filesystem. It can access a virtualized block device such as /dev/dm-0 or a physical block device such as /dev/sda.

iops is written in Python and is quickly installed:

cd /usr/local/bin
curl -O https://raw.githubusercontent.com/cxcv/iops/master/iops
chmod a+rx iops

In Listing 3, iops is running 32 threads on a slow hard disk; it reads random blocks here and doubles the block size step by step. For small blocks (512 bytes to 128KB), the number of possible operations remains almost constant, but the transfer rate doubles, paralleling the block size. This is due to the read-ahead behavior of the disk we tested – it always reads 128KB blocks, even if less data is requested.

Listing 3

IOPS on a Hard Disk

# iops /dev/sdb
/dev/sdb,   1.00 TB, 32 threads:
512   B blocks:   76.7 IO/s,  38.3 KiB/s (314.1 kbit/s)
   1 KiB blocks:   84.4 IO/s,  84.4 KiB/s (691.8 kbit/s)
   2 KiB blocks:   81.3 IO/s, 162.6 KiB/s (  1.3 Mbit/s)
   4 KiB blocks:   80.2 IO/s, 320.8 KiB/s (  2.6 Mbit/s)
   8 KiB blocks:   79.8 IO/s, 638.4 KiB/s (  5.2 Mbit/s)
  16 KiB blocks:   79.2 IO/s,   1.2 MiB/s ( 10.4 Mbit/s)
  32 KiB blocks:   81.8 IO/s,   2.6 MiB/s ( 21.4 Mbit/s)
  64 KiB blocks:   78.0 IO/s,   4.9 MiB/s ( 40.9 Mbit/s)
128 KiB blocks:   76.0 IO/s,   9.5 MiB/s ( 79.7 Mbit/s)
256 KiB blocks:   53.9 IO/s,  13.5 MiB/s (113.1 Mbit/s)
512 KiB blocks:   39.8 IO/s,  19.9 MiB/s (166.9 Mbit/s)
   1 MiB blocks:   33.3 IO/s,  33.3 MiB/s (279.0 Mbit/s)
   2 MiB blocks:   25.3 IO/s,  50.6 MiB/s (424.9 Mbit/s)

As the block size continues to grow, the transfer rate becomes increasingly important; a track change is only possible after fully reading the current block. For even larger blocks, as of about 2MB, the transfer rate finally becomes authoritative – the measurement has then reached the dimension of sequential reading.

Listing 4 repeats the test on an SSD. Again, you first see constant IOPS (from 512 bytes to 8KB) and a doubling of the transfer rate in line with the block size. However, the number of possible operations already drops from a block size of 8KB. The maximum transfer rate is reached at 64KB; the block size no longer affects the transfer rate from here on. Both of these examples are typical: SSD disks are usually faster in sequential access than magnetic hard drives, and they offer far faster random access.

Listing 4

IOPS on an SSD

# iops /dev/sda
/dev/sda, 120.03 GB, 32 threads:
512   B blocks: 21556.8 IO/s,  10.5 MiB/s ( 88.3 Mbit/s)
   1 KiB blocks: 21591.8 IO/s,  21.1 MiB/s (176.9 Mbit/s)
   2 KiB blocks: 21556.3 IO/s,  42.1 MiB/s (353.2 Mbit/s)
   4 KiB blocks: 21654.4 IO/s,  84.6 MiB/s (709.6 Mbit/s)
   8 KiB blocks: 21665.1 IO/s, 169.3 MiB/s (  1.4 Gbit/s)
  16 KiB blocks: 13364.2 IO/s, 208.8 MiB/s (  1.8 Gbit/s)
  32 KiB blocks:  7621.1 IO/s, 238.2 MiB/s (  2.0 Gbit/s)
  64 KiB blocks:  4162.3 IO/s, 260.1 MiB/s (  2.2 Gbit/s)
128 KiB blocks:  2176.5 IO/s, 272.1 MiB/s (  2.3 Gbit/s)
256 KiB blocks:   751.2 IO/s, 187.8 MiB/s (  1.6 Gbit/s)
 512 KiB blocks:   448.7 IO/s, 224.3 MiB/s (  1.9 Gbit/s)
   1 MiB blocks:   250.0 IO/s, 250.0 MiB/s (  2.1 Gbit/s)
   2 MiB blocks:   134.8 IO/s, 269.5 MiB/s (  2.3 Gbit/s)
   4 MiB blocks:    69.2 IO/s, 276.7 MiB/s (  2.3 Gbit/s)
   8 MiB blocks:    34.1 IO/s, 272.7 MiB/s (  2.3 Gbit/s)
   16 MiB blocks:   17.2 IO/s, 275.6 MiB/s (  2.3 Gbit/s)

The iometer Program

Iometer [2] is a graphical tool for testing disk and network I/O on one or more computers. The terminology takes some getting used to; for example, the term Manager is used for Computer, and Worker is used for Thread. Iometer can be used on Windows and Linux and provides a graphical front end, as shown in Figure 7.

Figure 7: Iometer enables measuring of different devices with multiple threads (workers).

It can measure both random and sequential read and write access; the user can specify a percentile relationship for both. Figure 8 shows the process. Write tests should take place only on empty disks, because the filesystem is ignored and overwritten. The results displayed are comprehensive, as shown in Figure 9. The tool shows IOPS, throughput, latency, and CPU usage.

Figure 8: Iometer allows the definition of multiple access patterns with different block sizes.
Figure 9: Iometer measures throughput, operation number, latency, and CPU load.

Buy this article as PDF

Express-Checkout as PDF
Price $2.95
(incl. VAT)

Buy ADMIN Magazine

SINGLE ISSUES
 
SUBSCRIPTIONS
 
TABLET & SMARTPHONE APPS
Get it on Google Play

US / Canada

Get it on Google Play

UK / Australia

Related content

  • Defining measures
    IOPS is mentioned quite often when benchmarking and testing storage systems, but what does it really mean? We discuss and explain what an IOPS is and how to measure it.
  • What is an IOPS Really?

    IOPS is mentioned quite often when benchmarking and testing storage systems, but what does it really mean? We discuss and explain what an IOPS is, and how to measure it.

  • Review: Accelerator card by OCZ for ESX server
    I/O throughput is a classic bottleneck, especially in virtualized environments. A flash cache card with matching software from OCZ promises to open up wide. We tested it.
  • The Benefit of Hybrid Drives
    People still use hard disks even when SSDs are much faster and more robust. One reason is the price; another is the lower capacity of flash storage. Hybrid drives promise to be as fast as SSDs while offering as much capacity as hard drives. But can they keep that promise?
  • SDS configuration and performance
    Software-defined storage promises centrally managed, heterogeneous storage with built-in redundancy. We examine how complicated it is to set up the necessary distributed filesystems. A benchmark shows which operations each system is best at tackling.
comments powered by Disqus
Subscribe to our ADMIN Newsletters
Subscribe to our Linux Newsletters
Find Linux and Open Source Jobs


Support Our Work

ADMIN content is made possible with support from readers like you. Please consider contributing when you've found an article to be beneficial.

Learn More”>
	</a>

<hr>		    
			</div>
		    		</div>

		<div class=