« Previous 1 2 3 4
Fundamentals of I/O benchmarking
Measure for Measure
Administrators wanting to examine a specific storage solution will have many questions. To begin: What is storage performance? Most admins will think of several I/O key performance indicators (KPIs), for which the focus is on one or the other. However, these metrics describe different things: Sometimes they relate to the filesystem, sometimes to raw storage, sometimes to read performance, and sometimes to write performance. Sometimes a cache is involved and sometimes not. Moreover, the various indicators are measured by different tools.
Once you have battled through to this point and clarified what you are measuring and with which tool, the next questions are just around the corner: Which component is the bottleneck that is impairing the performance of the system? What storage performance does your application actually need? In this article, we will help you answer all these questions.
Fundamentals
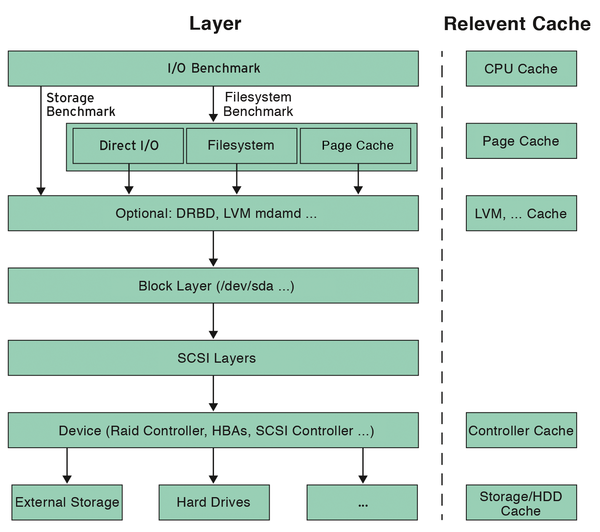
An I/O request passes through several layers (Figure 1) in the operating system. These layers each build on one another. For example, the application and filesystem layer (with technologies such as LVM, DRBD, mdadm, multipathing, devmapper, etc.) is based on the block virtualization layer. Closer to the hardware, you will find the block layer, the SCSI layers, and finally the devices themselves (RAID controllers, HBAs, etc.).
Buy this article as PDF
(incl. VAT)
Buy ADMIN Magazine
Related content
-
Defining measures
 IOPS is mentioned quite often when benchmarking and testing storage systems, but what does it really mean? We discuss and explain what an IOPS is and how to measure it.
 -
What is an IOPS Really?

IOPS is mentioned quite often when benchmarking and testing storage systems, but what does it really mean? We discuss and explain what an IOPS is, and how to measure it.
-
Get the best out of your bandwidth with tc
 If you're looking for a way to make the most of available bandwidth, we'll show you how to throttle and shape traffic with tc.
 -
Linux filesystem performance tested
 Choosing the right filesystem for a particular job can be a difficult task. We tested seven candidates and found some interesting results to make an administrator's choice easier.
 -
Review: Accelerator card by OCZ for ESX server
 I/O throughput is a classic bottleneck, especially in virtualized environments. A flash cache card with matching software from OCZ promises to open up wide. We tested it.
Subscribe to our ADMIN Newsletters
Subscribe to our Linux Newsletters
Find Linux and Open Source Jobs
Most Popular
Support Our Work
ADMIN content is made possible with support from readers like you. Please consider contributing when you've found an article to be beneficial.
