Wireshark
Retrospective Analysis
All of the functions that I have looked at thus far relate mainly to capturing the data that you want to investigate. Filters are mainly used to restrict the anticipated data volume, but they can also restrict the investigation to possibly suspicious ports or protocols.
Additionally, Wireshark offers an impressive range of analysis functions in the Analyze menu. Besides using the toolbar to create display filters, you can also target and disable individual protocols here (Figure 7).
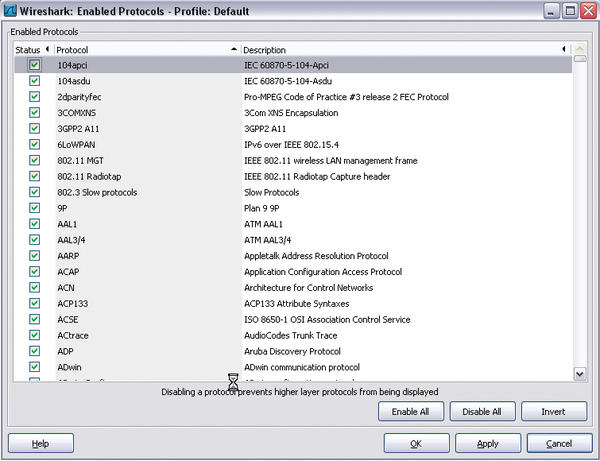 Figure 7: Wireshark supports a huge range of critical protocols that the administrator can use to filter data.
The Analyze | Expert Infos option is very powerful and useful; it provides an overview of the selected protocol sequence from which you can glean useful information for troubleshooting (Figure 8).
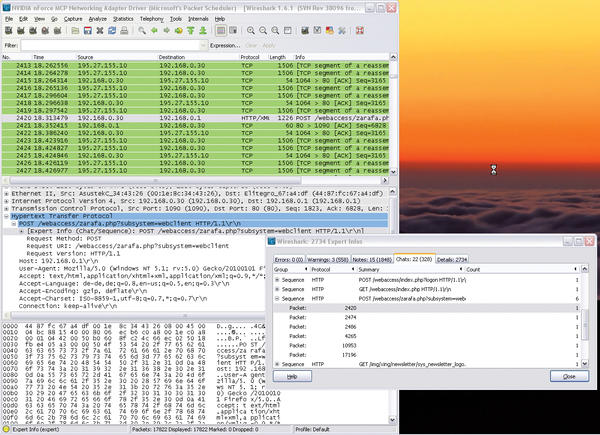 Figure 8: Wireshark lets you visualize the protocol sequence in detail.
For example, if you want to follow the details of an authentication handshake, Wireshark offers you a stream trace function in Analyze | Follow TCP Stream (alternatively, Follow UDP Stream and Follow SSL Stream ). I’ll look at an example of an SSH login to illustrate this. To begin, you need to enable an SSH server on a second machine and then run Wireshark on the first machine and initiate an SSH login. Before doing so, you need to configure Wireshark to use a protocol filter that only records the packets belonging to an SSH session. To do so, you need to restrict the capture to the SSH protocol using either capture or display filters. The capture filter would look like this:
port 22
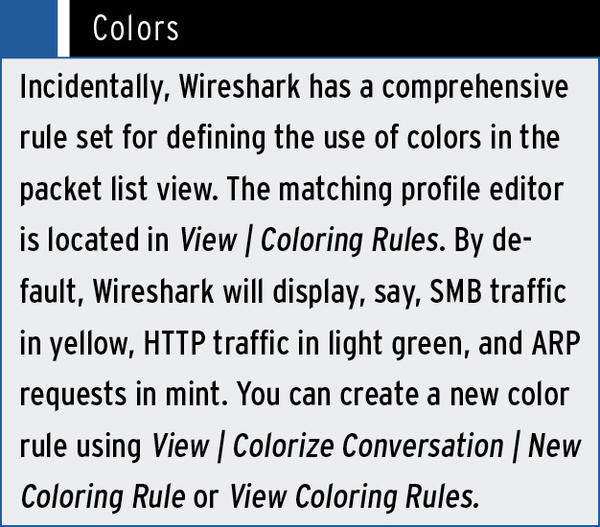
Then start capturing, initiate an SSH login at the console, and in the Analyze menu, select Follow TCP Stream . The result should look something like Figure 9 (see also “Colors” box).
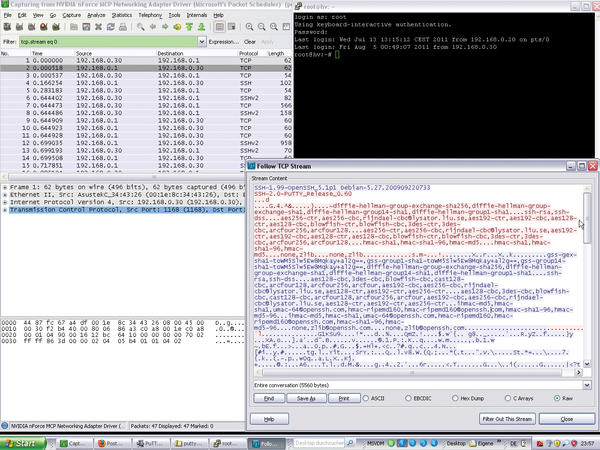 Figure 9: The ability to follow TCP or UDP streams packet by packet is really useful.
Because SSH connections are encrypted, a hacker will not be able to glean any useful information by deploying Wireshark. However, the example shows you how easily you could use the Follow TCP Stream to sniff a telnet login, for example, or – if you want something more up to date – an HTTP login that is not secured by SSL (see “Legal Note” box).
Statistics
Wireshark’s Statistics menu also offers useful statistics functions for IP addresses, packet lengths, protocol types, communication endpoints, conversations, service response times, and many other things.
The Statistics | UDP Multicast-Streams is both interesting and useful. If you suspect VoIP problems, or experience issues with Internet-based voice transmissions, you should check out the Telephony menu. It gives you a fast option for filtering data traffic for telephony data analysis purposes for both the signaling traffic (SIP) and the voice traffic (RTP) on UDP. With the Telephony | SIP … and Telephony | RTP menu items, you can easily create matching filters and generate statistics, a particularly powerful function. Telephony | RTP | Show All Streams quickly filters and visualizes all existing RTP streams. RTP stream analysis in Telephony | SIP | Stream Analysis then generates statistics for the selected RTP stream, including the arrival time of the packet, the delay, and the jitter.
Related content
-
Network analysis with Wireshark
 An administrator can only gain useful insights from network analysis if they understand the underlying procedures and protocols. The new version of Wireshark, 1.6, formerly known as Ethereal, can interpret around 30 new protocols.
 - Wireshark 4.4 Released
-
Detecting and analyzing man-in-the-middle attacks
 Wireshark and a combination of tools comprehensively analyze your security architecture.
 -
Monitoring IPv6 with Wireshark
 Although IPv6 is still waiting for its big breakthrough, on many networks, admins can no longer avoid it. Luckily, the free Wireshark tool can provide valuable error analysis.
 -
Check your VoIP networks with SIPVicious and sngrep
 Open source tools can help you discover vulnerabilities in VoIP networks, fix typical problems, and boost infrastructure security and functionality.
Subscribe to our ADMIN Newsletters
Subscribe to our Linux Newsletters
Find Linux and Open Source Jobs
Most Popular
Focus On Self-Hosting
• Self-Hosted Collaboration with Forgejo
• Self-Hosted PaaS with Coolify
• Build and Host Docker Images
• Self-Hosted Pritunl VPN Server with MFA
• Self-Hosted Chat Servers
Support Our Work
ADMIN content is made possible with support from readers like you. Please consider contributing when you've found an article to be beneficial.
