Lead Image © Lucy Baldwin, 123RF.com

Lead Image © Lucy Baldwin, 123RF.com

System temperature as a dimension  of  performance

Heat Seeker

Article from ADMIN 72/2022
By
Sensor tools can provide highly variable data from CPUs, GPUs, and a variety of sources. We look at some tools to verify the temperature of components on diverse hardware.

Excessive or just elevated temperature is sometimes the source of unexpected behavior in computing components – I faced it firsthand once, with runaway CPU heat burning through an older Slot I Pentium 3 processor. The cause was a detached heat sink, and some older hardware did not have built-in protection circuitry back then. I have also had fun experiencing intriguing boot failures from an overheating hard drive in a system equipped with one too many peripherals. In recent times I have taken a more preemptive stance, monitoring the heat build-up in a Raspberry Pi cluster as the case fan was replaced (Figure 1) [1]. To silence a desktop cluster, I replaced the built-in fan with a slower, silent fan made by specialty vendor Noctua [2]. Because the newer fan used fewer revolutions per minute to get the job done, I had to verify that the temperature inside the case remained roughly the same after the change:

vcgencmd measure_temp
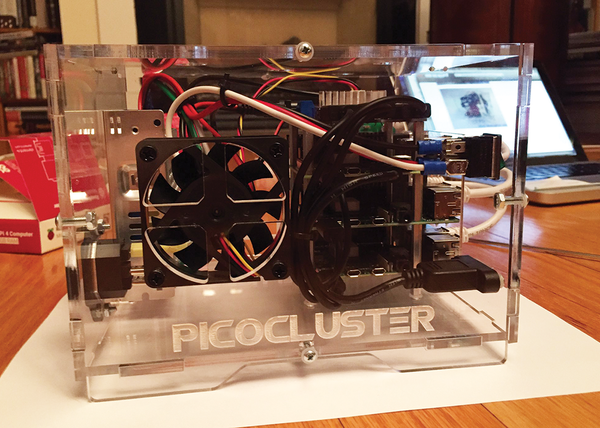
Figure 1: Raspberry Pi 4 Picocluster in testing.

The output quickly demonstrated that the temperature remained within the same range it had with the older fan. The vcgencmd utility is a tool made by Broadcom to access the state of the VideoCore GPU found on all Raspberry Pi boards [3]. It can also provide insight into voltage levels for cores and SDRAM, among other things, which can come handy while troubleshooting heat problems (Figure 2).

Figure 2: vcgencmd extracting temperature and voltage information from a Raspberry Pi GPU. Note the use of parallel SSH syntax to access all nodes in a cluster.

Terminal UI Redux

Returning to a common topic on these pages, an interesting example of a terminal user interface (TUI) [4] for the Mac is the istats tool (install from Ruby Gems with gem install iStats) [5]. iStats provides convenient access to temperature, battery, and fan speed data on macOS systems (Figure 3). Its simple and easy-to-use interface belies a hidden complexity. The istats scan command will look for additional "keys" of sensor data available on a given system and offer to enable them at the user's discretion (Figure 4).

Figure 3: iStats at work on a Mac. The chart of the number of battery cycles of this old battery is actually blinking in red!
Figure 4: iStats scanning sensors available on an older MacBook Pro. Not all values discovered are temperatures.

On Linux, my default choice for in-terminal monitoring TUI is glances  [6], which I have examined previously for its many capabilities [7]. Yet, I did not look at its temperature module, an oversight Figure 5 now aims to remedy. Data is sourced from the sensors [8] command (apt install lm-sensors), which is a configurable, consistent command-line interface gathering the multitude sensor data exposed by a disparate array of Linux kernel modules (Listing 1; from the same system on which glances was run). Indeed, if this tour of sensor tools and interfaces has shown one thing, it is that the variety of sensor data available is highly variable. Ranging from a Raspberry Pi, to a vintage MacBook Pro, to an HP Microserver, every system has provided different datasets. Often the biggest challenge is correctly identifying the source of the data, which can originate in a CPU, a GPU, a management card, and a variety of alternative sources.

Listing 1

sensors Output

federico@ferenginar:~$ sensors
k10temp-pci-00c3
Adapter: PCI adapter
temp1:        +42.5¡C  (high = +70.0¡C)
                       (crit = +100.0¡C, hyst = +95.0¡C)
federico@ferenginar:~$
Figure 5: glances presents temperature data on its left-hand panel whenever it is available.

Let There Be Dell

Switching to a fourth system, this one running Linux on an Intel processor, I can make use of i7z [9], a tool explicitly written to visualize the state of Intel processors  – including their temperature. Figure 6 shows the results on an Intel Core-equipped laptop. The more general purpose solution is to configure lm-sensors to include kernel modules for all sensors available, which is done through the sensors-detect command in a way akin to what was previously described for iStats. With lm-sensors, you can actually configure the kernel to load the correct modules at boot time, as recently described by our own Bruce Byfield in sister publication Linux Magazine [10]. Once this configuration step is successfully accomplished, all data for a specific system becomes available in the usual filesystem locations (usually in /sys/), ready to be consumed by higher level programs (Figure 7).

Figure 6: i7z at work, constantly refreshing CPU state data, including temperatures.
Figure 7: The complete range of sensors available on a Dell XPS 13 9360 "Sputnik."

One such example is psensor [11], a GUI application charting select metrics and sensors to facilitate time series analysis. Not perfectly polished in its windowing toolkit interactions, at least in Ubuntu 22.04, it nonetheless remains the best option currently available (Figure 8).

Figure 8: psensor charting some of the sensors listed in Figure 7.

Disk Sensors

The all-purpose smartctl utility offers storage device temperature data (apt install smartmontools) [12] equally well for spinning media and solid-state NVMe storage (Listing 2; from a persistent storage SMART source). It is generally advisable to maintain storage media under 60¡C (140¡F), with the actual drive's specification having the final say.

Listing 2

Extracting Temperature Data

federico@voronoi:~$ sudo smartctl -A /dev/nvme0 | grep Temperature
[sudo] password for federico:
Temperature:                        42 Celsius
Warning  Comp. Temperature Time:    16
Critical Comp. Temperature Time:    28
Temperature Sensor 1:               42 Celsius
federico@voronoi:~$

Infos

  1. Sound-proofing a Picocluster: https://twitter.com/0xF2/status/1244422315011645444
  2. Noctua NF-A6x25 PWM, Premium Quiet Fan, 4-Pin (60mm): https://www.amazon.com/gp/product/B00VXTANZ4/
  3. vcgencmd on Embedded Linux: https://elinux.org/RPI_vcgencmd_usage
  4. "Network Performance In-Terminal Graphics Tools" by Federico Lucifredi, ADMIN , issue 51, 2019, pg 94, https://www.admin-magazine.com/Archive/2019/51/Network-performance-in-terminal-graphics-tools
  5. Christophe Naud-Dulude, iStats: https://github.com/Chris911/iStats
  6. Nicolas Hennion, glances: https://github.com/nicolargo/glances
  7. "Next-Generation Terminal UI Tools" by Federico Lucifredi, ADMIN , issue 64, 2021, pg. 93, https://www.admin-magazine.com/Archive/2021/64/Next-generation-terminal-UI-tools
  8. lm-sensors repository: https://github.com/lm-sensors/lm-sensors
  9. Abhishek Jaiantilal, i7z: https://github.com/ajaiantilal/i7z
  10. "Taking Your Hardware's Temperature" by Bruce Byfield, Linux Magazine , issue 261, August 2022, pg. 44, https://www.linuxpromagazine.com/Issues/2022/261/Beat-the-Heat
  11. Francis Chin, psensor: https://github.com/chinf/psensor
  12. smartmontools: https://github.com/smartmontools/smartmontools/

The Author

Federico Lucifredi (@0xf2) is the Product Management Director for Ceph Storage at Red Hat and formerly the Ubuntu Server Product Manager at Canonical and the Linux "Systems Management Czar" at SUSE. He enjoys arcane hardware issues and shell-scripting mysteries and takes his McFlurry shaken, not stirred. You can read more from him in the new O'Reilly title AWS System Administration .

Buy this article as PDF

Express-Checkout as PDF
Price $2.95
(incl. VAT)

Buy ADMIN Magazine

SINGLE ISSUES
 
SUBSCRIPTIONS
 
TABLET & SMARTPHONE APPS
Get it on Google Play

US / Canada

Get it on Google Play

UK / Australia

Related content

comments powered by Disqus
Subscribe to our ADMIN Newsletters
Subscribe to our Linux Newsletters
Find Linux and Open Source Jobs


Support Our Work

ADMIN content is made possible with support from readers like you. Please consider contributing when you've found an article to be beneficial.

Learn More”>
	</a>

<hr>		    
			</div>
		    		</div>

		<div class=