Wireshark
Getting Started
Before you run Wireshark for the first time, you need to configure it. In the Capture | Options menu, start by defining the network interface that Wireshark will use to capture data traffic in the list field top right (Figure 1). You can also click the Options button for a NIC in the Capture | Interfaces menu, which shows you all the network interface built into the client, to access this dialog.
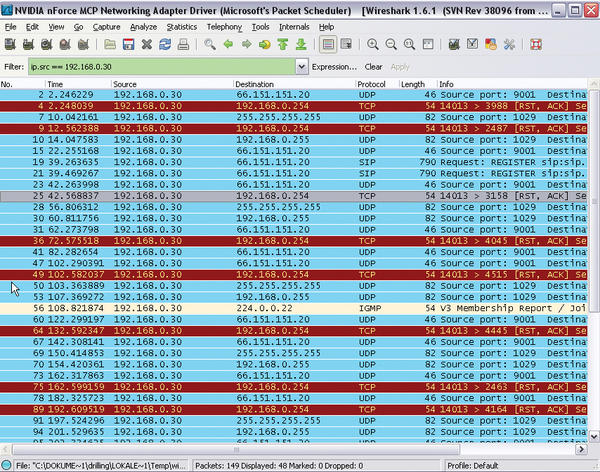 Figure 1: Before you start capturing packets, you first need to configure Wireshark in Capture | Options.
You can also define a number of other framework conditions in this dialog. For example, you can define your own filters in the field to the right of the Capture Filter button. The data volume you can expect will depend on how the host you want to analyze is connected to the Internet. You can use a filter to tell Wireshark to accept only Internet data traffic for this post or to restrict the protocols to ones that are actually related to the problem. If you don’t do this, you will first need to search for the relevant packets from a huge number of protocols or broadcasts.
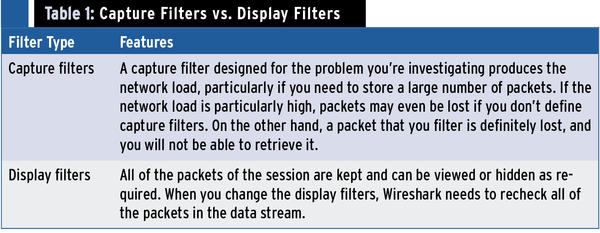
Wireshark uses two kinds of filters with different syntax (unfortunately): capture filters and display filters. Capture filters allow the administrator to tell Wireshark which packets to capture; they define the expected volume of data and are thus responsible for analyzing the existing databases. Based on the results of capture filtering, you can derive display filters for the type of analysis you want to perform. Capture filters use the Libpcap syntax. To filter for a specific MAC address, you would do the following in
Libpcap syntax:
ether host 00:25:4b:bd:24:94
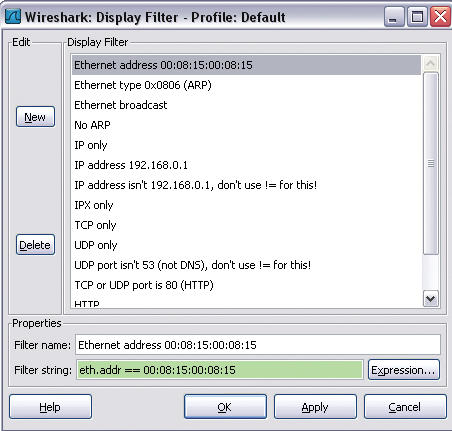 Figure 2: Wireshark includes a number of predefined display filters and supports interactive creation of display filters thanks to its filter toolbar.
However, if you want to restrict the display to this MAC address, the corresponding display filter syntax would be as follows:
eth.addr==00.25.4b.bd.24.94
That said, display filters are far more flexible. With display filters, you can include all supported packet types (Figure 2).
The decision to use capture filters or display filters depends on a number of factors. For an overview of the most important advantages and disadvantages, refer to Table 1.
Configuring Wireshark
To familiarize yourself with Wireshark, you might be interested in a bird’s-eye view of the network traffic that reaches the host in question. For this, you first need to close all known applications that regularly communicate on the network, such as your browser, email client, or messengers. After this, access the network interface card in the Capture | Options menu and, if needed, change the buffer size to suit your requirements. The selected buffer size also defines the number of packets at Wireshark can keep in memory before the program used to write data to your disk. A larger value is recommended in networks with an extremely high volume of data.
As described previously, the Capture packets in promiscuous mode option tells the interface to capture all incoming data traffic and pass data on to the operating system or processing. Normally, you don’t need to limit the packet size, so this option is not set by default. Because in this example, I want to analyze all data traffic, I will not apply a capture filter right now. You will probably also want to disable Update list of packets in real time in Display Options to avoid Wireshark using up more than its fair share of system resources.
Another important option is found at the bottom right in the Name Resolution area. If you select Enable Network Name Resolution , Wireshark will use DNS to convert all IP addresses into names, which can take some time. This explains why the option is disabled by default and why Enable MAC name resolution is enabled instead.
You can use the Capture Files(s) area to define how the capture data are stored. Normally, Wireshark will store all capture data in a single file, which you can define at this point. If you don’t specify a file, Wireshark will automatically store the data temporarily, and you can use the File menu to specify a file in which you will store the data. The Use multiple files option also lets you spread the load over multiple files. You can also restrict the file size or the data volume by enabling a ring buffer. In this case, Wireshark will always overwrite older data when the defined thresholds are exceeded.
Start tells Wireshark to start recording data. To record the data traffic for the selected device, you need to run Wireshark for a while; Wireshark will permanently display the packets it has captured in the packet list. The functions in the Go menu let you navigate the packet list. You can now start, or ask the user to start, some typical applications such as web applications in the browser or VoIP tools. The Protocol option shows you the protocol group to which each IP packet belongs. After some time, you can then select Capture | Stop to stop recording, and Wireshark will display all of the packets it has captured (Figure 3).
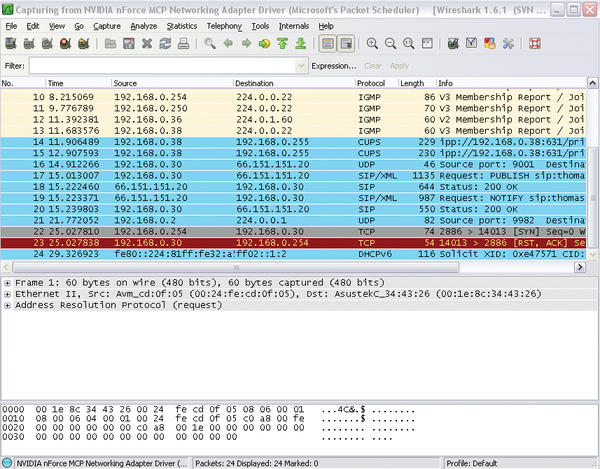 Figure 3: Launching Wireshark without filters makes the complete data traffic on the selected interface visible.
Related content
-
Network analysis with Wireshark
 An administrator can only gain useful insights from network analysis if they understand the underlying procedures and protocols. The new version of Wireshark, 1.6, formerly known as Ethereal, can interpret around 30 new protocols.
 - Wireshark 4.4 Released
-
Detecting and analyzing man-in-the-middle attacks
 Wireshark and a combination of tools comprehensively analyze your security architecture.
 -
Monitoring IPv6 with Wireshark
 Although IPv6 is still waiting for its big breakthrough, on many networks, admins can no longer avoid it. Luckily, the free Wireshark tool can provide valuable error analysis.
 -
Check your VoIP networks with SIPVicious and sngrep
 Open source tools can help you discover vulnerabilities in VoIP networks, fix typical problems, and boost infrastructure security and functionality.
Subscribe to our ADMIN Newsletters
Subscribe to our Linux Newsletters
Find Linux and Open Source Jobs
Most Popular
Focus On Self-Hosting
• Wiring the Modern Stack with Node-RED
• Self-Hosted Collaboration with Forgejo
• Self-Hosted PaaS with Coolify
• Build and Host Docker Images
• Self-Hosted Pritunl VPN Server with MFA
• Self-Hosted Chat Servers
Support Our Work
ADMIN content is made possible with support from readers like you. Please consider contributing when you've found an article to be beneficial.
