« Previous 1 2 3 4
Monitoring and service discovery with Consul
Staying on Top
The cloud is rightly considered one of the most significant developments in IT in recent years: It clearly divides the industry into two groups – service providers and users – each of which has specific requirements.
One requirement concerns monitoring: Conventional monitoring in a cloud makes neither the providers of the large platforms nor their users happy, because what makes the cloud special is that it serves up resources dynamically. If the user needs a large amount of power at the moment, they book a corresponding number of virtual machines (VMs). If they only need a fraction of these resources later on, they return the redundant capacity to the cloud provider's pool.
The pool, however, must be monitored very carefully by the provider. The provider needs to know at all times how many resources can still be distributed to users – and when it's time to scale up the platform by adding more hardware.
A Different Kind of Monitoring
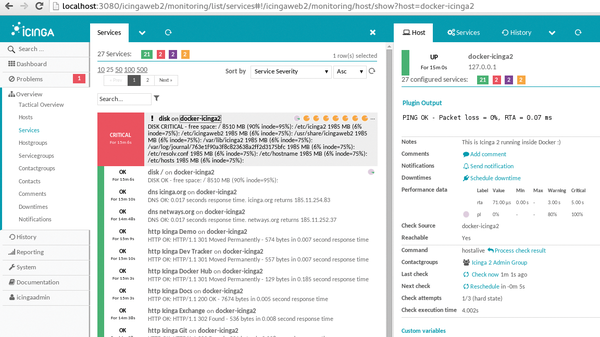
From the user's and the provider's point of view, traditional monitoring approaches are of limited suitability for monitoring cloud platforms. Their view of the world is usually binary: Either a system or a service works as required, so that the corresponding entry on the monitoring system is green, or not, in which case the entry is red, and an escalation spiral is set in motion (Figure 1). If necessary, admins are dragged from their beds.
Buy this article as PDF
(incl. VAT)
Buy ADMIN Magazine
US / Canada
UK / Australia
Related content
-
Service discovery, monitoring, load balancing, and more with Consul
 Modern-day DevOps techniques bring automation to everyday tasks, such as service discovery, monitoring, and load balancing.
 -
The advantages of configuration management tools
 Etcd, ZooKeeper, Consul, and similar programs are currently the subject of heated debate in the world of configuration management. We investigate the problems they seek to solve and promises they make.
 -
Vagrant, Serf, Packer, and Consul create and manage development environments
 Four open source tools – Vagrant, Serf, Packer, and Consul – facilitate a developer's work by each handling one specific task elegantly.
 -
Central logging for Kubernetes users
 Grafana's Loki is a good replacement candidate for the Elasticsearch, Logstash, and Kibana combination in Kubernetes environments.
 -
A versatile proxy for microservice architectures
 The nimble Envoy proxy server addresses modern container environments, but does it outperform its rival Istio, which has Envoy at its core?
Subscribe to our ADMIN Newsletters
Subscribe to our Linux Newsletters
Find Linux and Open Source Jobs
Most Popular
Support Our Work
ADMIN content is made possible with support from readers like you. Please consider contributing when you've found an article to be beneficial.
