


Lead Image © Lucy Baldwin, 123RF.com
Read this article on our new ADMIN website
https://www.admin-it.io/bottom-the-new-top/
Bottom: The new top
From Top to Bottom
Bottom (btm) [1] is the humorously named successor to top. Blending mouse interaction and keystrokes in a terminal window, Bottom is pushing forward a crowded, ever-advancing field led until recently by bashtop [2] [3], its more performant cousin bpytop [4], and many others [5] alongside the evergreen original top [6].
Rust-based, Bottom promises a more lightweight and highly customizable cross-platform experience; on macOS, install via Brew (brew install bottom). On Ubuntu, the choice of hosting packages in GitHub repos instead of Ubuntu Universe makes the command choice dependent on architecture in the apt path, but a straightforward Snap install is available:
sudo snap install btop; sudo snap connect btop:removable-media
Refer to the project homepage for more details [7].
Kicking Tires
Among so many options, what makes btm special? It provides immediate and time series monitoring of CPU, memory, network activity, processes, and disk usage like other tools, but it does it with characteristic flair. An interesting example is found in the six pre-built color themes, their styles ranging from ice blue to retro-groovy cool. The default
color scheme is selected when no selection is made, but you can see a few of the alternative choices available in Figure 1. Nothing should stop you from creating your own template if you do not like those supplied.
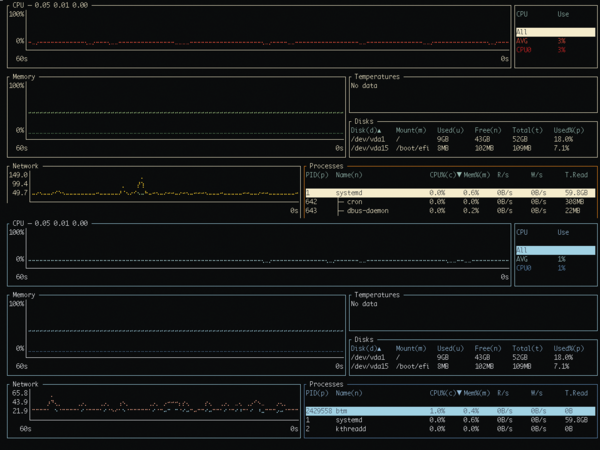 Figure 1: Up top, the gruvbox color scheme; at bottom, the nord color scheme.
Naturally the tool ships with its own man page, which comes in very handy when studying command-line options; however, in interactive mode, all one really needs to remember is the ? keystroke. A handy in-tool pop-up several pages long comprehensively details how to interact with each widget and its respective options, in what really ought to be a terminal user interface (TUI) best practice (Figure 2).
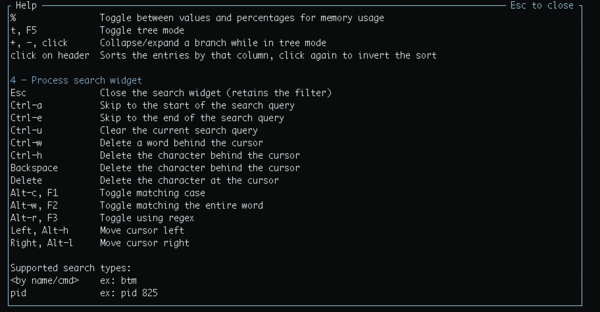 Figure 2: The application's help screen is always one keystroke away.
Fans of htop [8] point out it is trivial to reproduce the same visualization in Bottom with
btm -b -r 2000
(Figure 3), which can be handy as htop undergoes maintainer transition. Another interesting option is the process tree view, triggered by t
or F5 (Figure 4), with the process widget at full screen (select with mouse click, press e
). Also of interest is the possibility to view the full command instead of the binary's name (P
). The F9 key, perhaps more easily remembered by vi users with the alternative mnemonic dd, is used to kill the selected process.
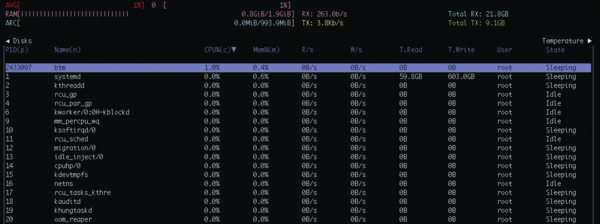 Figure 3: Process view in the style of htop, but rendered in Bottom.
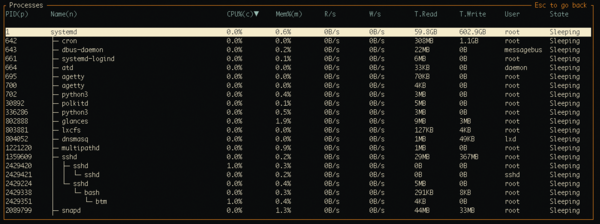 Figure 4: Process tree view with a color scheme applied.
Searching and Sorting
Bottom includes extensive facilities to search, and hopefully find, processes and their command options. The / key starts the search, which can use just a string, or a full regular expression if that is required by the task. Sorting is most easily accomplished with a mouse click on the field of interest, in the process view, disk status, or temperatures widget. Time series widgets also respond to the scrollbar and equivalent touchpad gestures (+ or – will produce the same outcome) by compressing or expanding the time base represented on the x -axis. Figure 5 demonstrates the result of this action on the network monitoring widget, created with the assistance of the update freeze (f ) key.
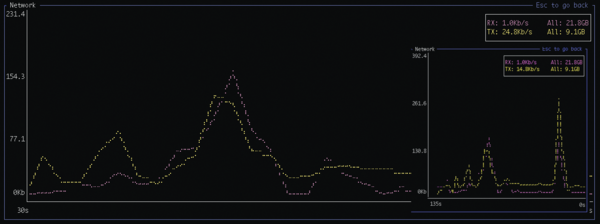 Figure 5: Network monitoring with a 30sec time base, and (inset) the same data compressed with a 135sec time axis.
Off to the Races
In a somewhat informal test, I have run btm in an otherwise completely idle Ubuntu Focal (20.04) single-core virtual machine hosted on Digital Ocean. With the benefit of the tool measuring itself in regards to system load for a few minutes, I observed it consistently hovering around 1% of CPU load (Figure 1, bottom view). In comparison, the much heftier glances [9], another favorite of mine, taxed the system between 2.5% and 3.4% in the same test setup (Figure 6). Since glances is a more complete and complex tool, a fairer comparison is with bashtop, the tool that launched the current wave of TUI tool development. Highly variable, bashtop ran most of the time between 3.5% and 6% of CPU – and I watched it spike above 7% (Figure 7)!
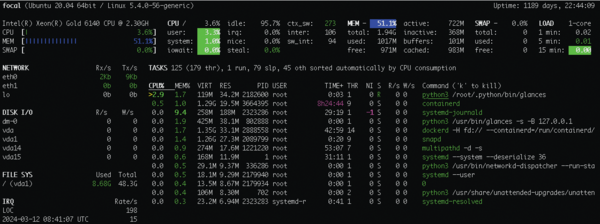 Figure 6: While somewhat long in the tooth, glances is one of the best terminal monitors around.
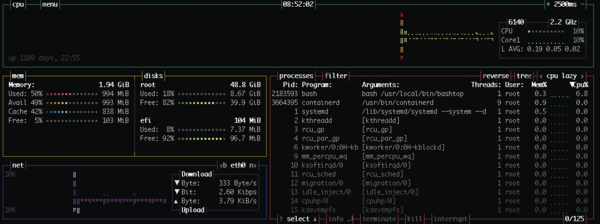 Figure 7: bashtop at work in my single-core test run.
Seven percent of CPU allocated to the measurement tool is clearly a lot. Thankfully, the author of bashtop iterated repeatedly on his subject, releasing bpytop first, which demonstrated a much reduced load of 1.2%-1.5% in this test (Figure 8) thanks to its Python redesign. Further improvement is being demonstrated by new developments in btop [10], rewritten fully in C++ and the champion of this little test, hovering around a remarkably low 0.5% (Figure 9).
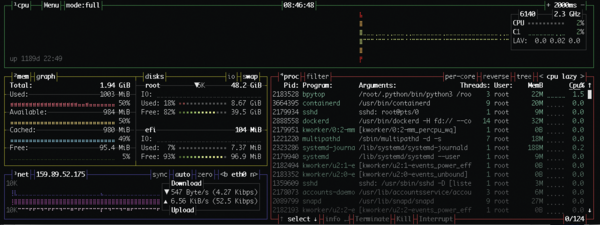 Figure 8: bpytop looking the same as Bashtop, but 75% less hungry for CPU cycles.
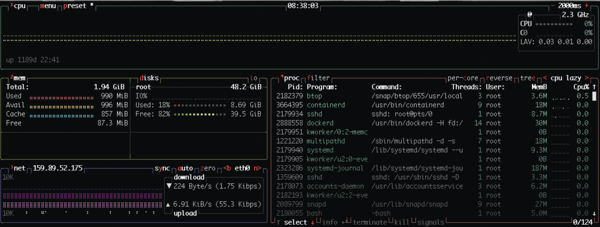 Figure 9: Thanks to its C++ implementation, btop is the new king of the hill.
The final choice is yours, but clearly btop and btm are the current top contestants when it comes to keeping tooling interference in your measurements in check – and saving CPUs so you can forget them while they run on your system.
Infos
- Clement Tsang, Bottom: https://github.com/ClementTsang/bottom
- Jakob P. Liljenberg, bashtop: https://github.com/aristocratos/bashtop
- "Next-Generation Terminal UI Tools" by Federico Lucifredi, ADMIN , issue 64, 2021, https://www.admin-magazine.com/Archive/2021/64/Next-generation-terminal-UI-tools
- Jakob P. Liljenberg, bpytop: https://github.com/aristocratos/bpytop
- "Network Performance In-Terminal Graphics Tools" by Federico Lucifredi, ADMIN , issue 51, 2019, https://www.admin-magazine.com/Archive/2019/51/Network-performance-in-terminal-graphics-tools
- "Exploring the Most Famous Performance Tool" by Federico Lucifredi, ADMIN , issue 46, 2018, https://www.admin-magazine.com/Archive/2018/46/Exploring-the-most-famous-performance-tool
- Bottom, install and support: https://github.com/ClementTsang/bottom#installation
- Hisham Muhammad, htop: https://en.wikipedia.org/wiki/Htop
- Nicolas Hennion, glances, https://github.com/nicolargo/glances
- Jakob P. Liljenberg, btop: https://github.com/aristocratos/btop

Read this article on our new ADMIN website
https://www.admin-it.io/bottom-the-new-top/
Buy this article as PDF
(incl. VAT)
Buy ADMIN Magazine
Related content
-
Bpytop command-line monitoring tool
 The bpytop command-line monitoring tool provides a variety of information via a fancy user interface and supports network monitoring and mouse- or keyboard-based control.
-
Next-generation terminal UI tools
 The implementation of terminal user interface libraries enables an impressive variety of in-terminal graphics.
-
A Bash-based monitoring tool
 In a sea of top-like tools, bashtop impresses with an easy-to-use and efficient interface.
-
ASCII-based monitoring tools
 If you like ASCII-based monitoring tools, take a look at three new tools – Zenith, Bpytop, and Bottom.
-
TUI Tools for Containers

Text-based user interface tools for a development container.
Subscribe to our ADMIN Newsletters
Subscribe to our Linux Newsletters
Find Linux and Open Source Jobs
Most Popular
Focus On Self-Hosting
• Running Your Own Matrix Server with Synapse
• Reliable Network Storage with TrueNAS Community Edition
• Self-Hosted File Syncing with Seafile
• Wiring the Modern Stack with Node-RED
• Self-Hosted Collaboration with Forgejo
• Self-Hosted PaaS with Coolify
• Build and Host Docker Images
• Self-Hosted Pritunl VPN Server with MFA
Support Our Work
ADMIN content is made possible with support from readers like you. Please consider contributing when you've found an article to be beneficial.